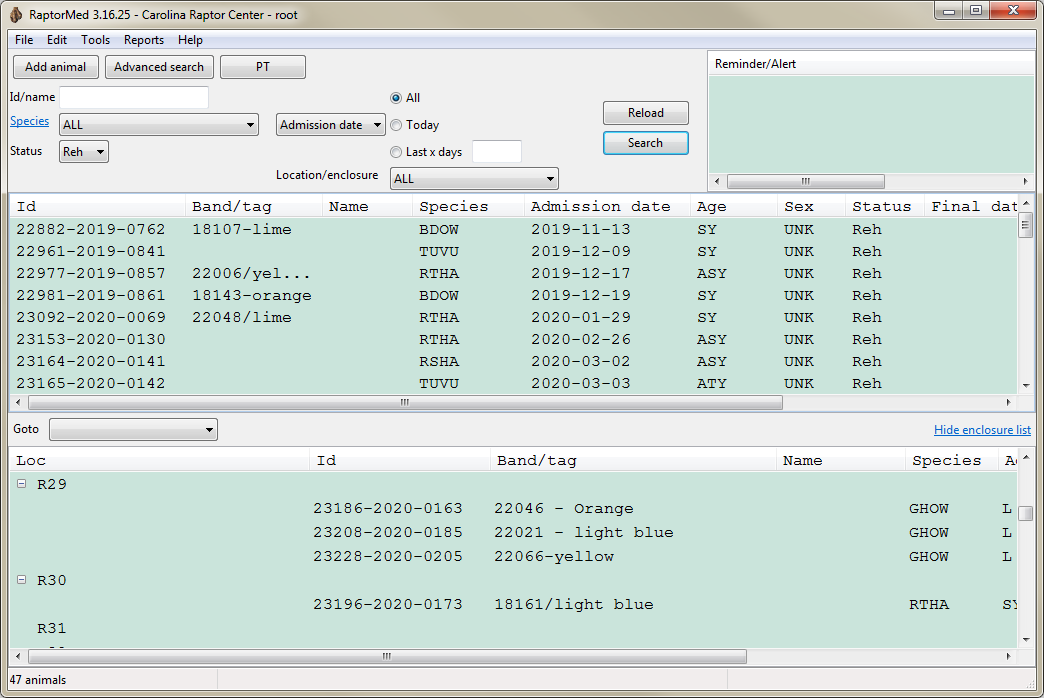
 The main screen has all animals in a list. The list can be filtered by several parameters
and it can be sorted. The animals are also displayed according to their location\cage.
Both views are very handy and allow your animal's medical record to be found quickly.
The main screen has all animals in a list. The list can be filtered by several parameters
and it can be sorted. The animals are also displayed according to their location\cage.
Both views are very handy and allow your animal's medical record to be found quickly.
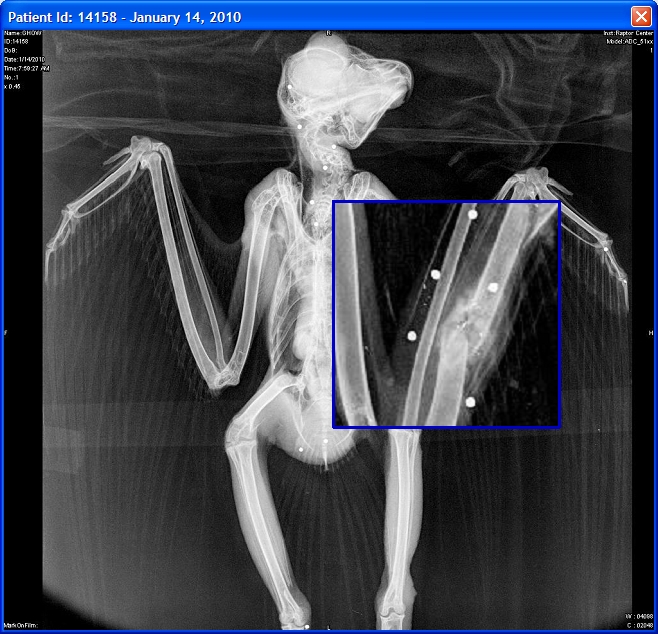 Images can be viewed and you can zoom in on areas of interest.
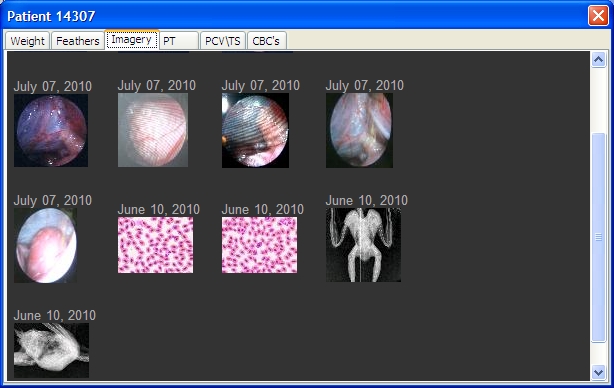 All imagery (radiographs, endoscopy, hematology, etc) can be easily stored in the system simply by
dragging an image file onto the patient's chart. All images are always at your fingertips and can be
viewed, zoomed, and exported at any time.
All imagery (radiographs, endoscopy, hematology, etc) can be easily stored in the system simply by
dragging an image file onto the patient's chart. All images are always at your fingertips and can be
viewed, zoomed, and exported at any time.
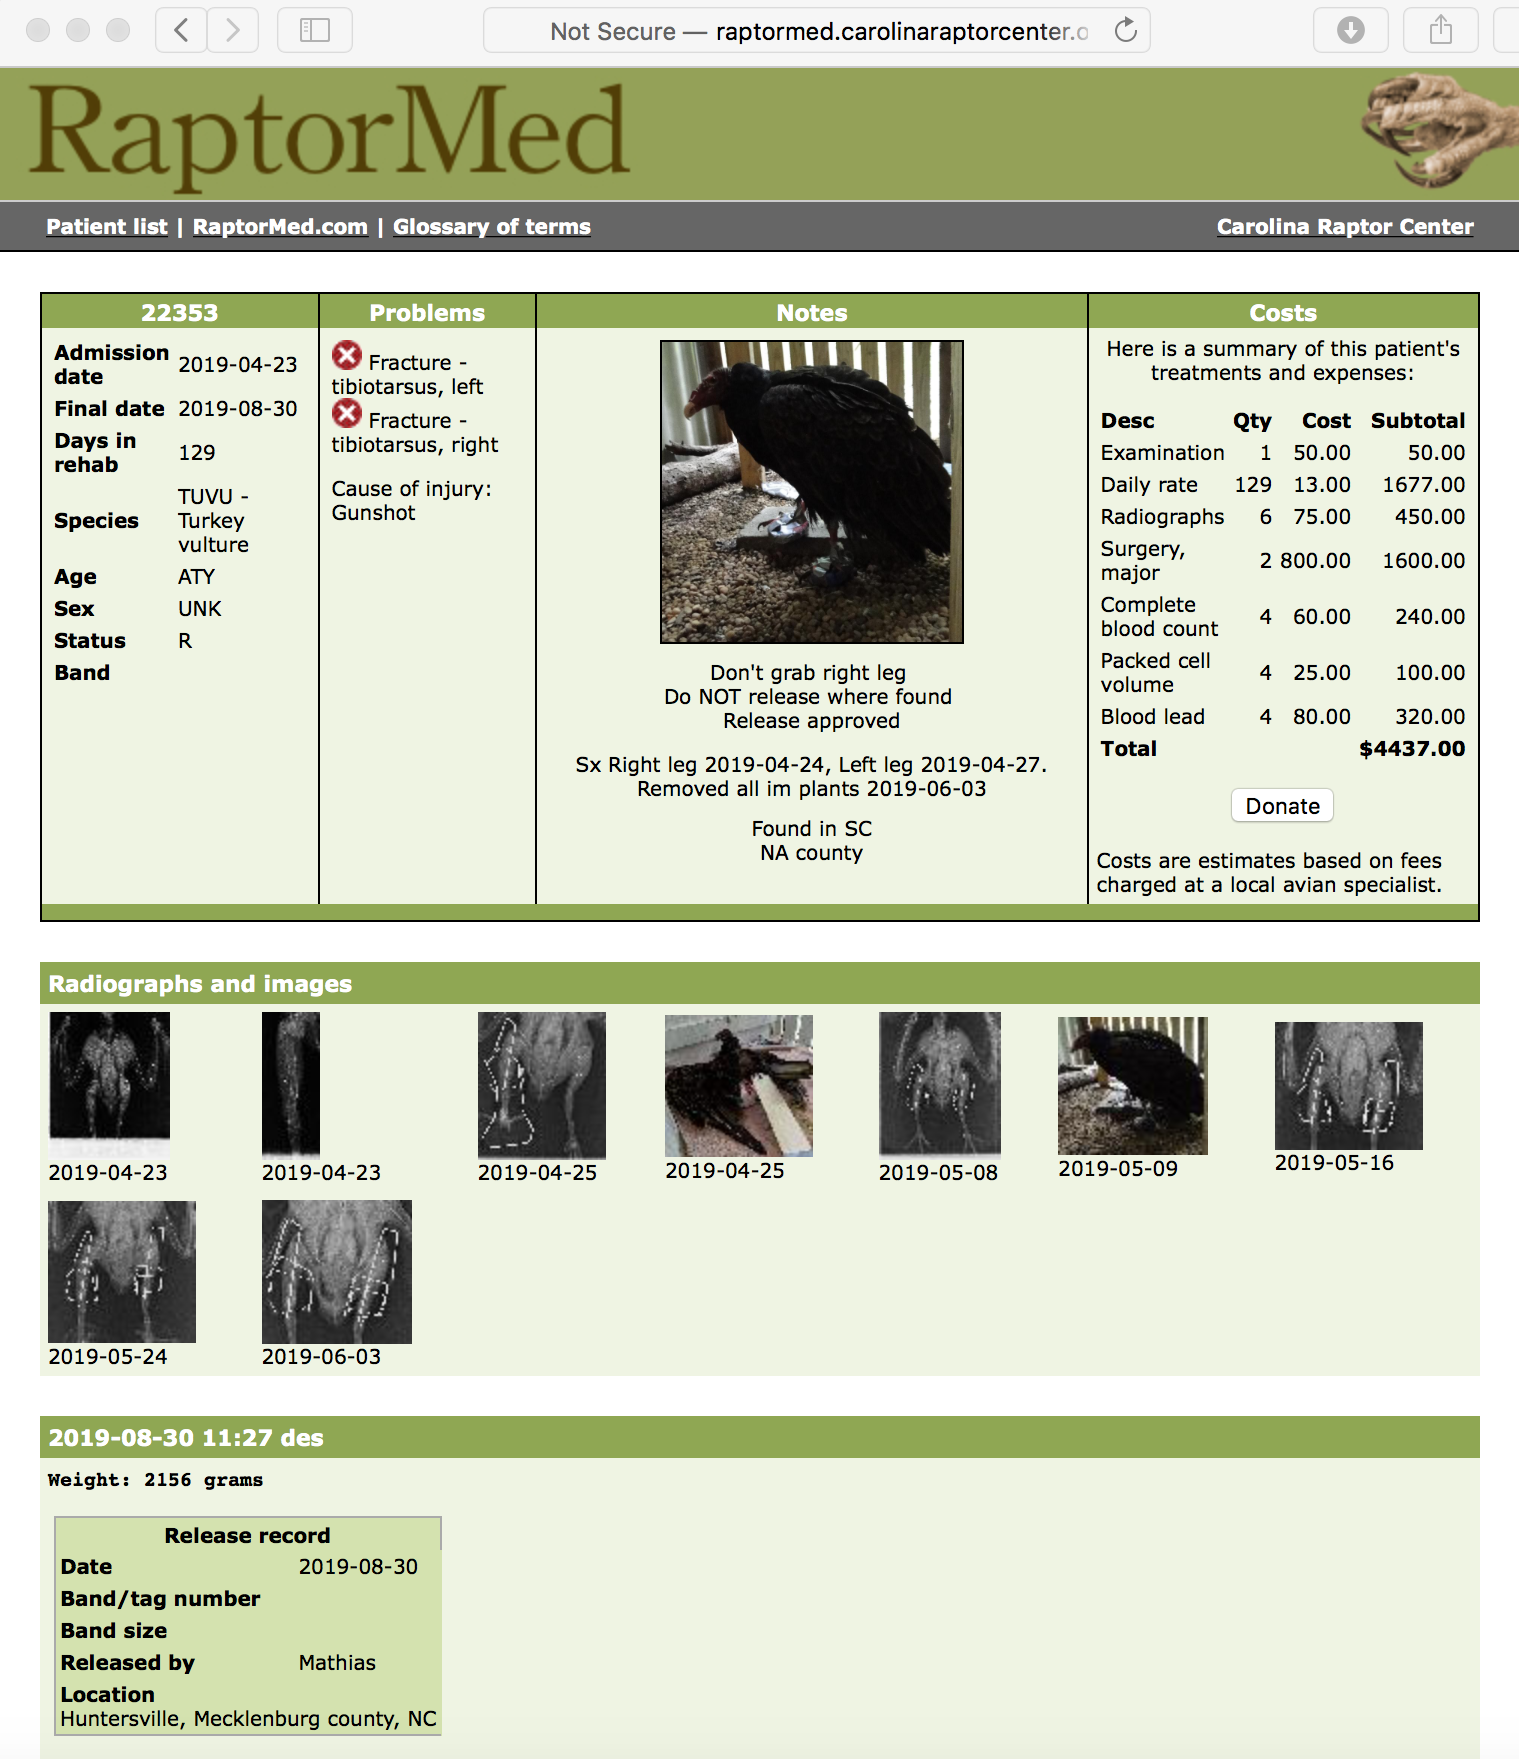 The animal's record page has a concise case summary at the top that includes the signalment
(species, age, etc.), the problem list as well as other important notes.
Each entry in the record is then listed chronologically with all images, radiographs and
lab work included.
The animal's record page has a concise case summary at the top that includes the signalment
(species, age, etc.), the problem list as well as other important notes.
Each entry in the record is then listed chronologically with all images, radiographs and
lab work included.
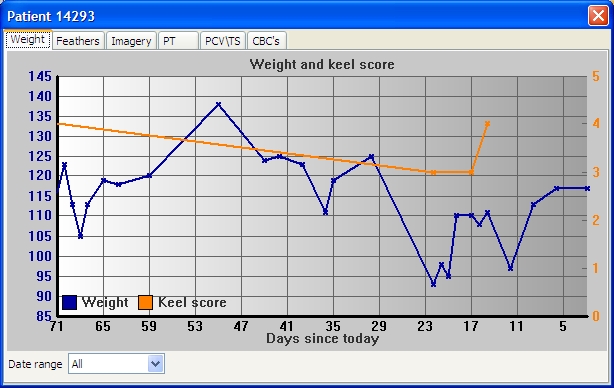 The weight and body condition score can be viewed graphically. The phrase "a picture is worth a
thousand words" really rings true here as it is easy to spot weight problems with the click of a button.
The weight and body condition score can be viewed graphically. The phrase "a picture is worth a
thousand words" really rings true here as it is easy to spot weight problems with the click of a button.
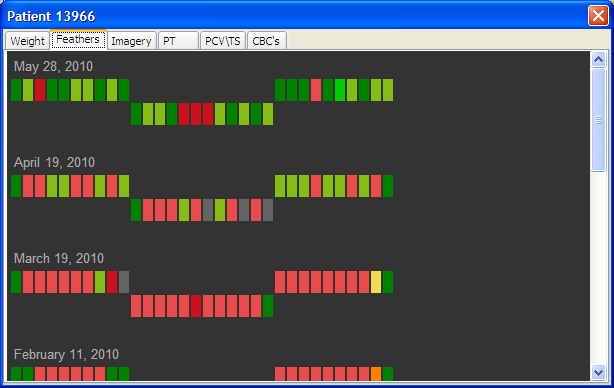 Feather status is also displayed graphically so it is very easy to gauge the progress of birds with
feather damage or that are waiting for a molt.
Feather status is also displayed graphically so it is very easy to gauge the progress of birds with
feather damage or that are waiting for a molt.
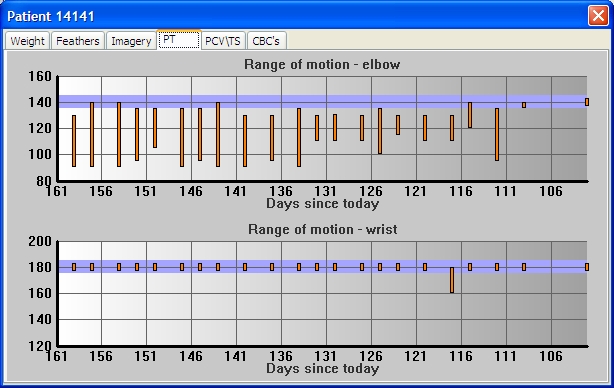 Physical therapy sessions are automatically plotted so you can quickly see trends and determine if
progress is being made.
Physical therapy sessions are automatically plotted so you can quickly see trends and determine if
progress is being made.
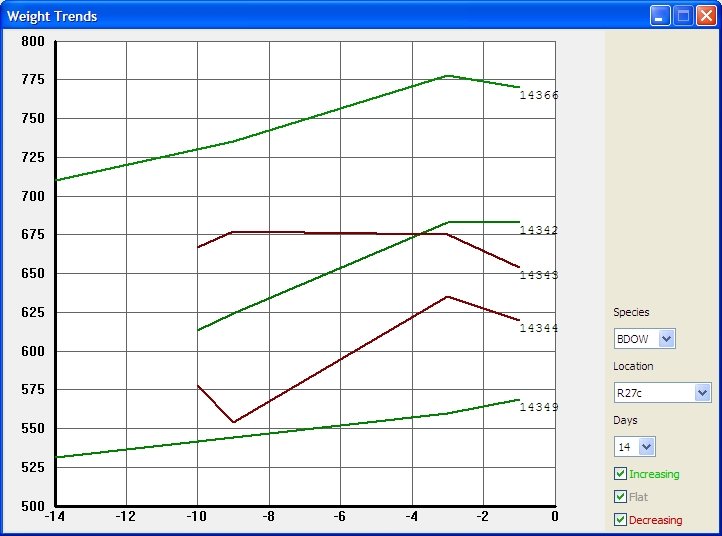 The weights for all animals in a single enclosure can be graphed together so it is easy to spot the ones
that aren't doing as well. This is especially important during baby season. Notice that downward trending lines
are highlighted in red.
The weights for all animals in a single enclosure can be graphed together so it is easy to spot the ones
that aren't doing as well. This is especially important during baby season. Notice that downward trending lines
are highlighted in red.
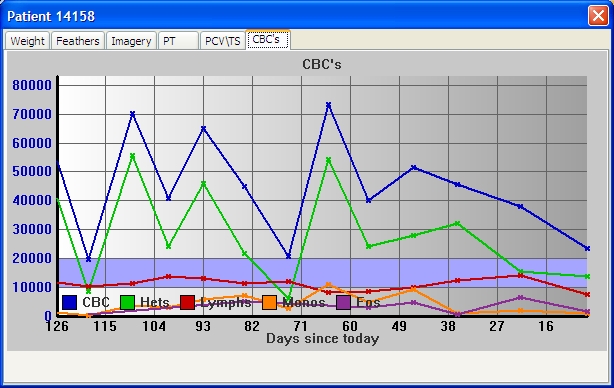 CBC results also are more meaningful when viewed graphically. Trends that might be impossible to
see with the raw numbers are now easy to spot.
CBC results also are more meaningful when viewed graphically. Trends that might be impossible to
see with the raw numbers are now easy to spot.
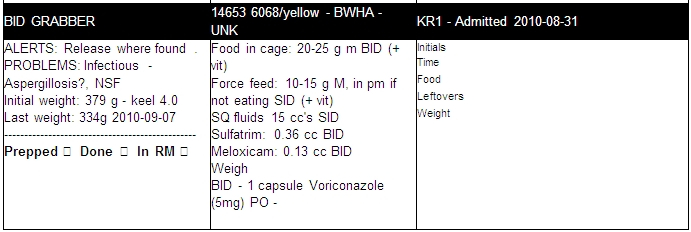 Treatment sheets are printed as needed and they present a concise summary what needs to be done for each
animal each day. These sheets are highly customized for each customer and this is just an example.
Treatment sheets are printed as needed and they present a concise summary what needs to be done for each
animal each day. These sheets are highly customized for each customer and this is just an example.
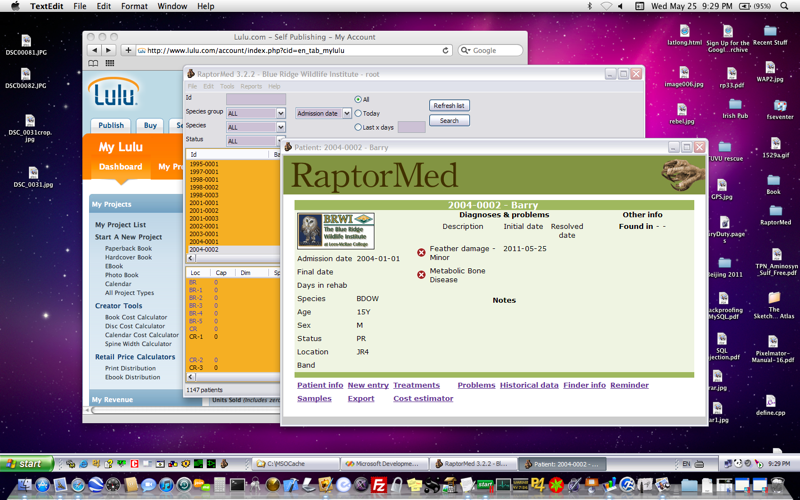 This screenshot shows RaptorMed running on Macintosh OSX using the Parallels virtual machine software.
RaptorMed runs beautifully this way and was actually developed on a MacBook Pro. While RaptorMed is a Windows
program it can also run on a Mac using Wine\CrossOver.
This screenshot shows RaptorMed running on Macintosh OSX using the Parallels virtual machine software.
RaptorMed runs beautifully this way and was actually developed on a MacBook Pro. While RaptorMed is a Windows
program it can also run on a Mac using Wine\CrossOver.
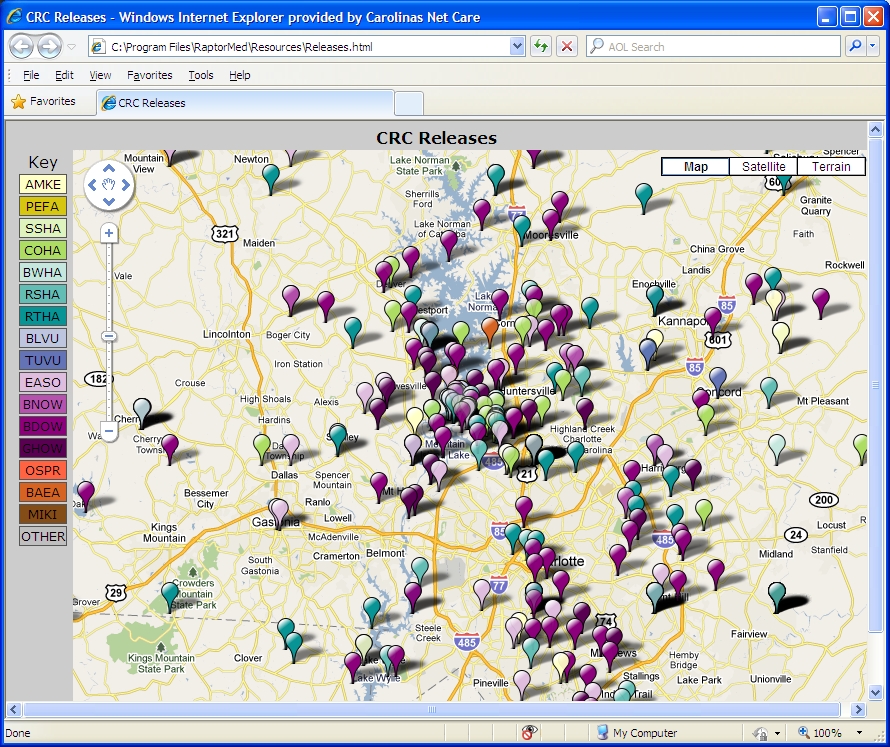 Plot your releases on a Google map. This allows you to plan your releases and avoid overcrowding
in a particular area. You can also auto-generate Google maps to show animal intakes as well as the locations
of other rehabilitators in your area.
Plot your releases on a Google map. This allows you to plan your releases and avoid overcrowding
in a particular area. You can also auto-generate Google maps to show animal intakes as well as the locations
of other rehabilitators in your area.
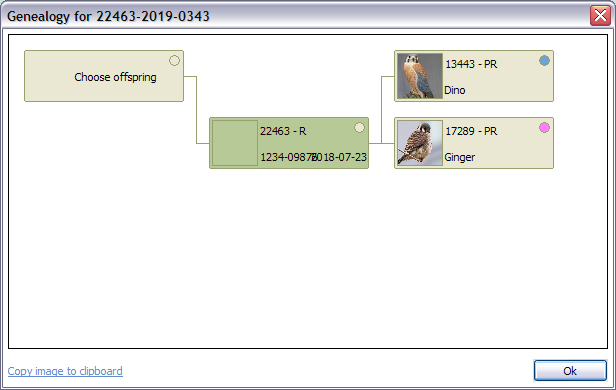 RaptorMed can help track the geneaology of your animals and build family trees.
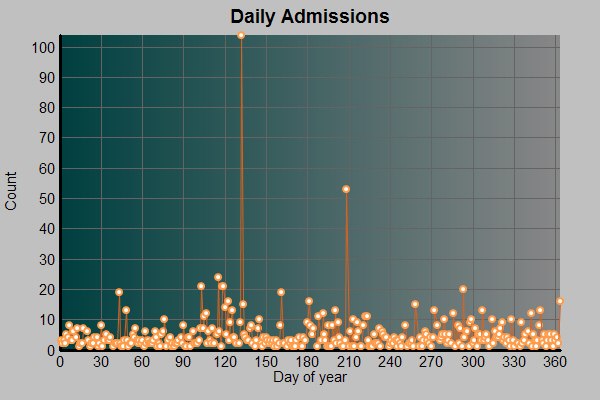 Generate beautiful graphs from your data with just a few mouse clicks. No need to for Excel.
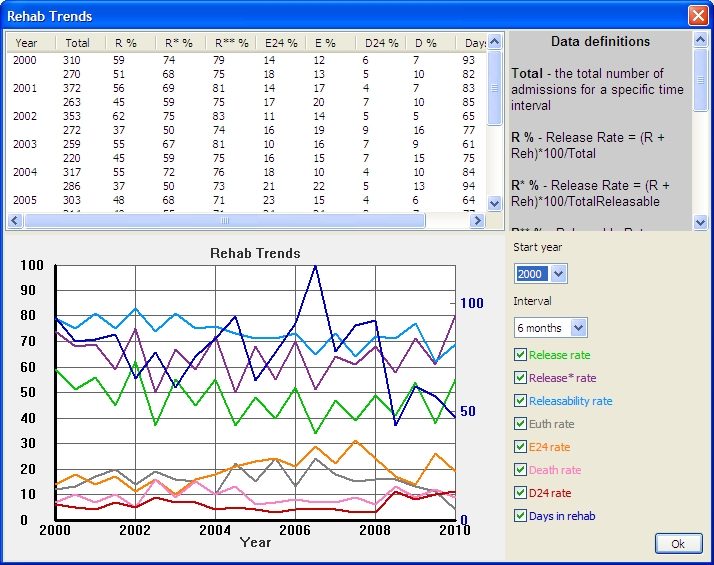 A whole array of meaningful statistics (such as admission numbers, release rates, average days in
rehab, etc) are immediately at your fingertips. Track your organization's stats over time and easily
spot areas of potential improvement.
A whole array of meaningful statistics (such as admission numbers, release rates, average days in
rehab, etc) are immediately at your fingertips. Track your organization's stats over time and easily
spot areas of potential improvement.
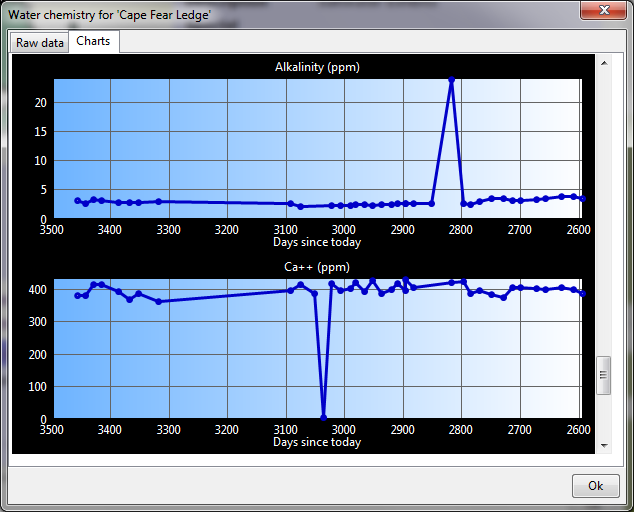 Monitor all sorts of parameters for your aquatic enclosures and receive auto-alerts if anything is out of range.
